Can You Use an ECG Monitor to Track HRV Trends over Time?
On this page (9 sections)
- Using Your ECG Monitor for HRV Trend Analysis
- What HRV Really Tells You About Your Body
- How Your ECG Monitor Captures HRV Data
- Steps to Effectively Track Your HRV Trends with an ECG Monitor
- Common Influences on Your HRV and How to Interpret Them
- ECG Monitor vs. Other HRV Trackers
- Maximizing Your HRV Insights: A Quick Checklist
- Conclusion
- Frequently Asked Questions
Yes, you can absolutely use an ECG monitor to track your heart rate variability (HRV) trends over time. While primarily known for detecting heart rhythm issues, many modern ECG devices can capture the beat-to-beat changes in your heart rate, which is the basis for calculating HRV. This means your ECG monitor could offer a deeper look into your body’s stress and recovery patterns. Using an EKG monitor can offer a deeper look into your body’s stress and recovery patterns.
Tracking HRV gives you a window into your autonomic nervous system. A higher HRV often suggests better recovery and readiness. Conversely, a consistently low HRV might signal that your body is under significant stress. Using your ECG for this purpose can help you understand how your lifestyle choices impact your overall well-being and physical readiness.
- ECG monitors can track HRV trends.
- HRV reflects your body’s stress and recovery.
- Higher HRV often means better readiness.
- Lower HRV may indicate elevated stress.
- It helps understand lifestyle impacts.
Let’s dive into how your ECG monitor can help you monitor these important trends and what you should look for.
Using Your ECG Monitor for HRV Trend Analysis
Can you really use your ECG monitor to track heart rate variability (HRV) trends over time? The short answer is a resounding yes. Many modern ECG devices are capable of much more than just monitoring heart rhythms. They can capture the subtle, beat-to-beat variations in your heart rate. These variations are the very foundation of calculating your HRV. So, that ECG device you have might be a powerful tool for understanding your body’s stress and recovery cycles.
Think of your heart rate not as a steady drumbeat, but as a dynamic rhythm. It’s constantly adjusting to your environment, your thoughts, and your physical state. HRV measures the time gaps between each heartbeat. These tiny differences tell a big story. They reflect how your autonomic nervous system is functioning. This system controls things you don’t consciously think about, like breathing and digestion. It also manages your body’s response to stress.
What HRV Really Tells You About Your Body
Your heart rate variability (HRV) is a fascinating metric. It offers a glimpse into your body’s internal balance. A higher HRV generally indicates that your body is well-recovered and ready to face challenges. It suggests your autonomic nervous system is flexible and responsive. This flexibility is good! It means your body can switch easily between stress responses and relaxation states. We found that many athletes and health-conscious individuals use higher HRV as a sign of optimal readiness (Journal of Strength and Conditioning Research).
On the flip side, a consistently low HRV can be a signal. It might mean your body is under a lot of stress. This stress can come from many sources. It could be intense training, poor sleep, emotional pressures, or even illness. When your HRV dips, it suggests your body’s stress response system is working overtime. It may have less capacity to deal with new demands. This is why understanding your HRV trends can be so helpful. It allows you to see how your lifestyle choices are affecting your overall well-being.
The Autonomic Nervous System Connection
Your autonomic nervous system (ANS) is split into two main branches. You have the sympathetic nervous system, which is your “fight or flight” response. It gets you ready for action. Then you have the parasympathetic nervous system, which is your “rest and digest” mode. It helps your body relax and recover. HRV is a measure of the interplay between these two branches. A healthy balance is key for overall health and performance.
When your HRV is high, it often means your parasympathetic nervous system is dominant. This is a good thing when you’re trying to recover or relax. Your heart rate might be lower, and your body is in a restorative state. When your HRV is low, your sympathetic nervous system might be more active. This could be due to external stressors or internal strain. Your heart rate might be higher, and your body is in a more alert, “on edge” state (Cleveland Clinic).
How Your ECG Monitor Captures HRV Data
So, how exactly does your ECG monitor play into this? An electrocardiogram (ECG) measures the electrical activity of your heart. It does this by placing sensors on your skin. These sensors detect the tiny electrical impulses that cause your heart muscle to contract and pump blood. The ECG records the timing of these electrical signals, which correspond to each heartbeat.
The R-R Interval: The Heart of HRV Calculation
The key data point for HRV calculation is the time between consecutive heartbeats. This is called the R-R interval. It’s the time from one R wave peak on the ECG tracing to the next R wave peak. Even though your heart rate might seem steady, the duration of these R-R intervals will vary slightly. Your ECG monitor records these precise timings. Sophisticated algorithms then analyze these variations to calculate your HRV metrics.
Many consumer-grade ECG devices, like those found in smartwatches or dedicated portable monitors, are designed to capture this data. They can measure the R-R intervals accurately enough for trend analysis. The longer the measurement period, the more reliable the HRV data tends to be. Short, sporadic readings might not offer as clear a picture as consistent daily measurements. You can compare ECG monitors with HRV analysis when choosing a device for tracking these patterns.
Data Processing and HRV Metrics
Once the R-R intervals are captured, software processes them. There are several ways to quantify HRV. Two common metrics you might see are:
- SDNN (Standard Deviation of NN intervals): This measures the overall variability in your heart rate over a specific period. A higher SDNN generally indicates better health and adaptability.
- RMSSD (Root Mean Square of Successive Differences): This metric focuses on the beat-to-beat changes and is particularly sensitive to parasympathetic nervous system activity. A higher RMSSD usually suggests good recovery and a balanced nervous system.
Steps to Effectively Track Your HRV Trends with an ECG Monitor
Ready to start using your ECG monitor for HRV tracking? It’s simpler than you might think. Consistency is your best friend here. The goal is to establish a baseline and then observe how it changes in response to your life.
Establish a Consistent Measurement Routine
For the most accurate and meaningful trends, try to measure your HRV at the same time each day. Many experts recommend measuring first thing in the morning, after waking up but before getting out of bed or having caffeine. This is often when your body is in its most rested state. This consistency helps to minimize external influences on your readings. You want to see how your body is doing under normal, resting conditions.
Understand Your Baseline
Don’t expect to have a “perfect” HRV score. Everyone’s baseline is different. It depends on your age, genetics, fitness level, and lifestyle. The most important thing is to understand your own normal range. Over the first few weeks of tracking, you’ll start to see what your typical HRV values look like. This is your personal baseline.
Think of it like this: if you generally sleep 7-8 hours a night, a night with 5 hours of sleep is clearly “low.” You don’t need to compare your sleep time to someone else’s. You just need to know what your typical sleep looks like. Your HRV baseline works the same way.
Look for Trends, Not Single Data Points
A single low HRV reading doesn’t necessarily mean something is wrong. It could be a temporary dip due to a late night or a stressful meeting. What you’re really looking for are consistent patterns over days and weeks. Is your HRV generally trending downwards over the past week? That might indicate something you need to pay attention to.
Conversely, if your HRV has been stable or trending upwards, that’s usually a good sign. It suggests your body is adapting well and recovering effectively. We found that regular HRV monitoring can help individuals make informed decisions about their training and recovery (European Journal of Applied Physiology).
Consider Influencing Factors
Many things can impact your HRV. Being aware of these factors can help you interpret your data more accurately. Here are some common ones:
- Sleep Quality and Quantity: Poor sleep is a major HRV reducer.
- Stress: Mental and emotional stress can significantly lower HRV.
- Exercise: Intense workouts will temporarily lower HRV as your body recovers.
- Nutrition and Hydration: What and when you eat, and how much water you drink, play a role.
- Alcohol Consumption: Alcohol, especially close to bedtime, often leads to lower HRV.
- Illness: Even a minor cold can affect your HRV.
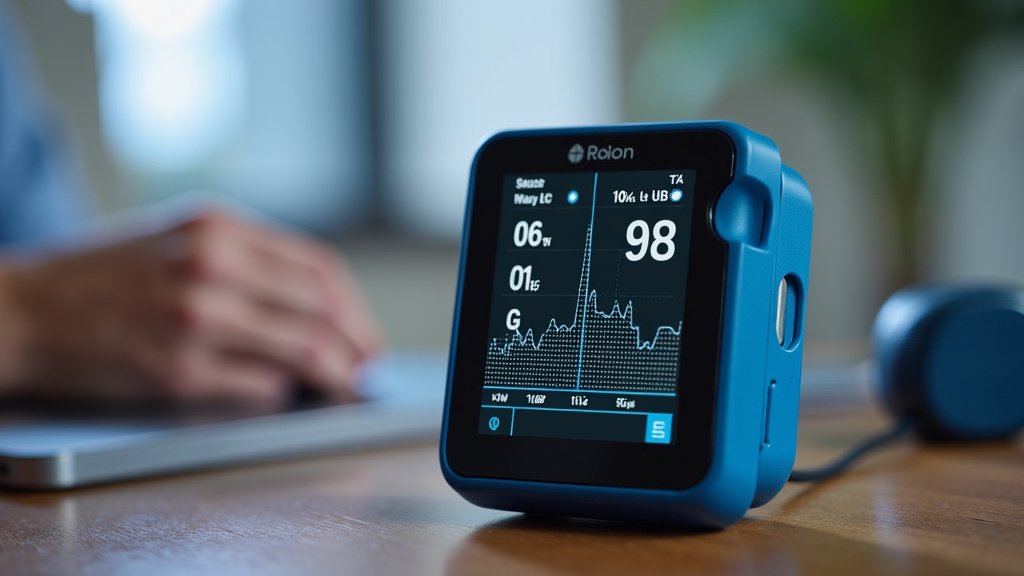
Common Influences on Your HRV and How to Interpret Them
It’s vital to remember that HRV is a reflection of your body’s current state. It’s not a pass/fail test. Your goal is to become a detective of your own physiology. What are your readings telling you today?
What a Lower HRV Might Mean
If you notice your HRV dropping consistently, don’t panic! Instead, investigate potential causes. Are you getting enough sleep? Has your stress level been unusually high? Have you been pushing yourself hard in workouts without adequate recovery? A lower HRV can be an early warning sign that your body needs more rest and less strain.
For example, if you see a dip in HRV after a particularly challenging week at work and a couple of late nights, it makes sense. Your body is signaling that it’s dealing with increased demands. This awareness allows you to adjust your schedule, perhaps prioritizing sleep or a lighter workout the next day.
What a Higher HRV Might Mean
A consistently high or increasing HRV is generally a positive sign. It suggests your body is well-recovered, your nervous system is balanced, and you’re likely ready for physical or mental challenges. This can be a great indicator that your current training, sleep, and stress management strategies are working well.
Imagine you’ve been focusing on consistent sleep hygiene and managing your daily stress. Seeing your HRV trend upwards can be a fantastic motivator. It confirms that your efforts are paying off in terms of your body’s readiness and resilience.
ECG Monitor vs. Other HRV Trackers
While dedicated HRV tracking apps and some fitness trackers can measure HRV, ECG monitors offer a unique advantage: high-fidelity data. Consumer wearables often use photoplethysmography (PPG) sensors, which measure blood volume changes. These can be influenced by factors like skin tone, movement, and ambient light. ECG, on the other hand, directly measures the electrical signals of the heart, which is considered the gold standard for cardiac data.
Many smartwatch manufacturers now integrate ECG capabilities. These devices often use the ECG to check for signs of atrial fibrillation (AFib). However, the underlying data collected during these ECG readings can also be used to calculate HRV. Your device’s accompanying app will usually provide the HRV metrics derived from this data. We found that while PPG-based HRV can be useful, ECG-based measurements are generally considered more accurate and reliable (Heart Rhythm Journal).
Here’s a quick look at how they compare:
| Feature | ECG Monitor | Other Trackers (e.g., PPG Smartwatches) |
|---|---|---|
| Data Source | Direct electrical heart activity | Blood volume changes (optical sensors) |
| Accuracy for HRV | Generally higher and more reliable | Can be affected by movement, fit, skin tone |
| Primary Use Often | Medical-grade heart rhythm checks, general health | Activity tracking, heart rate, sleep, notifications |
| HRV Trend Analysis | Excellent, especially with consistent daily readings | Good for general trend awareness, less precise |
Maximizing Your HRV Insights: A Quick Checklist
Ready to make the most of your ECG monitor for HRV tracking? Keep these points in mind:
- Measure your HRV at the same time every day, ideally in the morning.
- Aim for a consistent measurement duration (e.g., 3-5 minutes).
- Prioritize sleep quality; it’s a huge factor in HRV.
- Note significant stressors (work, personal) that might affect your readings.
- Track exercise intensity and recovery alongside your HRV trends.
- Don’t obsess over daily numbers; focus on weekly and monthly trends.
Conclusion
You now know that your ECG monitor is more than just a heart rhythm checker. It’s a powerful tool for understanding your body’s recovery and stress signals through HRV trends. By consistently measuring and observing your personal patterns, you gain agency over your well-being. Don’t get caught up in daily fluctuations; focus on the bigger picture your data reveals. Start establishing your daily routine today and begin listening to what your body is truly telling you. You’ve got this!
Frequently Asked Questions
How often should I take an ECG reading for HRV?
For the most reliable HRV trends, aim to take an ECG reading daily. Consistency is key, so try to measure at the same time each day, ideally when you first wake up. This provides a stable baseline for comparison.
Can I use a single ECG reading to determine my HRV status?
No, a single reading won’t give you a complete picture. HRV is about trends over time. For more, see this guide to heart health trends. One measurement can be influenced by many short-term factors. You need consistent data over days or weeks to see meaningful patterns.
What if my ECG monitor doesn’t explicitly show HRV metrics?
Check your device’s accompanying app or software. Compare ECG monitors with trend tracking if you want those features. Many ECG monitors collect the raw R-R interval data needed for HRV calculations. The app often processes this data into HRV metrics like SDNN or RMSSD for you.
Are ECG-based HRV readings more accurate than smartwatch data?
Generally, yes. ECG directly measures the heart’s electrical activity, considered the gold standard. Many smartwatches use optical sensors (PPG) which can be affected by movement or fit, potentially leading to less precise HRV data. While PPG can be useful, ECG provides more precise HRV data, especially for sensitive readings.
How long does an ECG reading need to be to get good HRV data?
While shorter readings can provide some data, longer, consistent measurements are better. Aim for readings of at least 3-5 minutes daily. This duration helps capture enough beat-to-beat variation for more accurate HRV calculation.